SPSS
SPSS (Statistical Package for Social Sciences) is a popular software tool used by researchers and analysts to make sense of large amounts of data. Think of it as a powerful calculator that helps people understand trends, patterns, and relationships in data. Market researchers use SPSS to analyze survey results, customer behavior, and market trends without having to do complex math by hand. Similar tools include SAS and R, but SPSS is known for being more user-friendly, especially for people who aren't programming experts. When you see SPSS on a resume, it usually means the person knows how to turn raw data into meaningful insights that companies can use to make business decisions.
Examples in Resumes
Analyzed customer satisfaction surveys using SPSS to identify key improvement areas
Conducted market trend analysis with SPSS and IBM SPSS to guide product development
Led team research projects utilizing SPSS Statistics for data interpretation and reporting
Typical job title: "Market Research Analysts"
Also try searching for:
Where to Find Market Research Analysts
Professional Networks
Learning Resources
Job Boards
Example Interview Questions
Senior Level Questions
Q: How would you design and analyze a complex market research study using SPSS?
Expected Answer: A senior analyst should explain how they would plan the study, choose appropriate statistical tests, handle data cleaning, and create meaningful reports for stakeholders. They should mention experience with advanced analyses like factor analysis or regression modeling.
Q: How do you ensure data quality and validate results in SPSS?
Expected Answer: Should discuss data cleaning procedures, checking for errors, validating assumptions, and ensuring statistical significance. Should mention experience training others and establishing best practices.
Mid Level Questions
Q: What types of statistical analyses have you performed using SPSS?
Expected Answer: Should be able to describe experience with common analyses like t-tests, ANOVA, correlation, and regression, and explain when to use each one in practical business situations.
Q: How do you prepare and clean data in SPSS?
Expected Answer: Should explain how they handle missing data, check for outliers, create new variables, and prepare data for analysis. Should mention experience with data transformation and coding.
Junior Level Questions
Q: What basic analyses can you perform in SPSS?
Expected Answer: Should be able to describe basic descriptive statistics, frequency tables, and simple charts. Should show understanding of data input and basic data management.
Q: How do you create charts and tables in SPSS?
Expected Answer: Should demonstrate knowledge of creating basic visualizations like bar charts, pie charts, and frequency tables, and explain how to format them for presentations.
Experience Level Indicators
Junior (0-2 years)
- Basic data entry and cleaning
- Simple statistical analyses
- Creating basic charts and tables
- Running frequency analyses
Mid (2-5 years)
- Complex statistical analyses
- Survey design and implementation
- Data preparation and cleaning
- Results interpretation and reporting
Senior (5+ years)
- Advanced statistical modeling
- Research methodology design
- Team training and management
- Strategic insights development
Red Flags to Watch For
- No experience with basic statistical concepts
- Unable to explain when to use different types of analyses
- Lack of experience with data cleaning and preparation
- No understanding of research methodology
- Cannot interpret statistical results in business context
Related Terms
Need more hiring wisdom? Check these out...

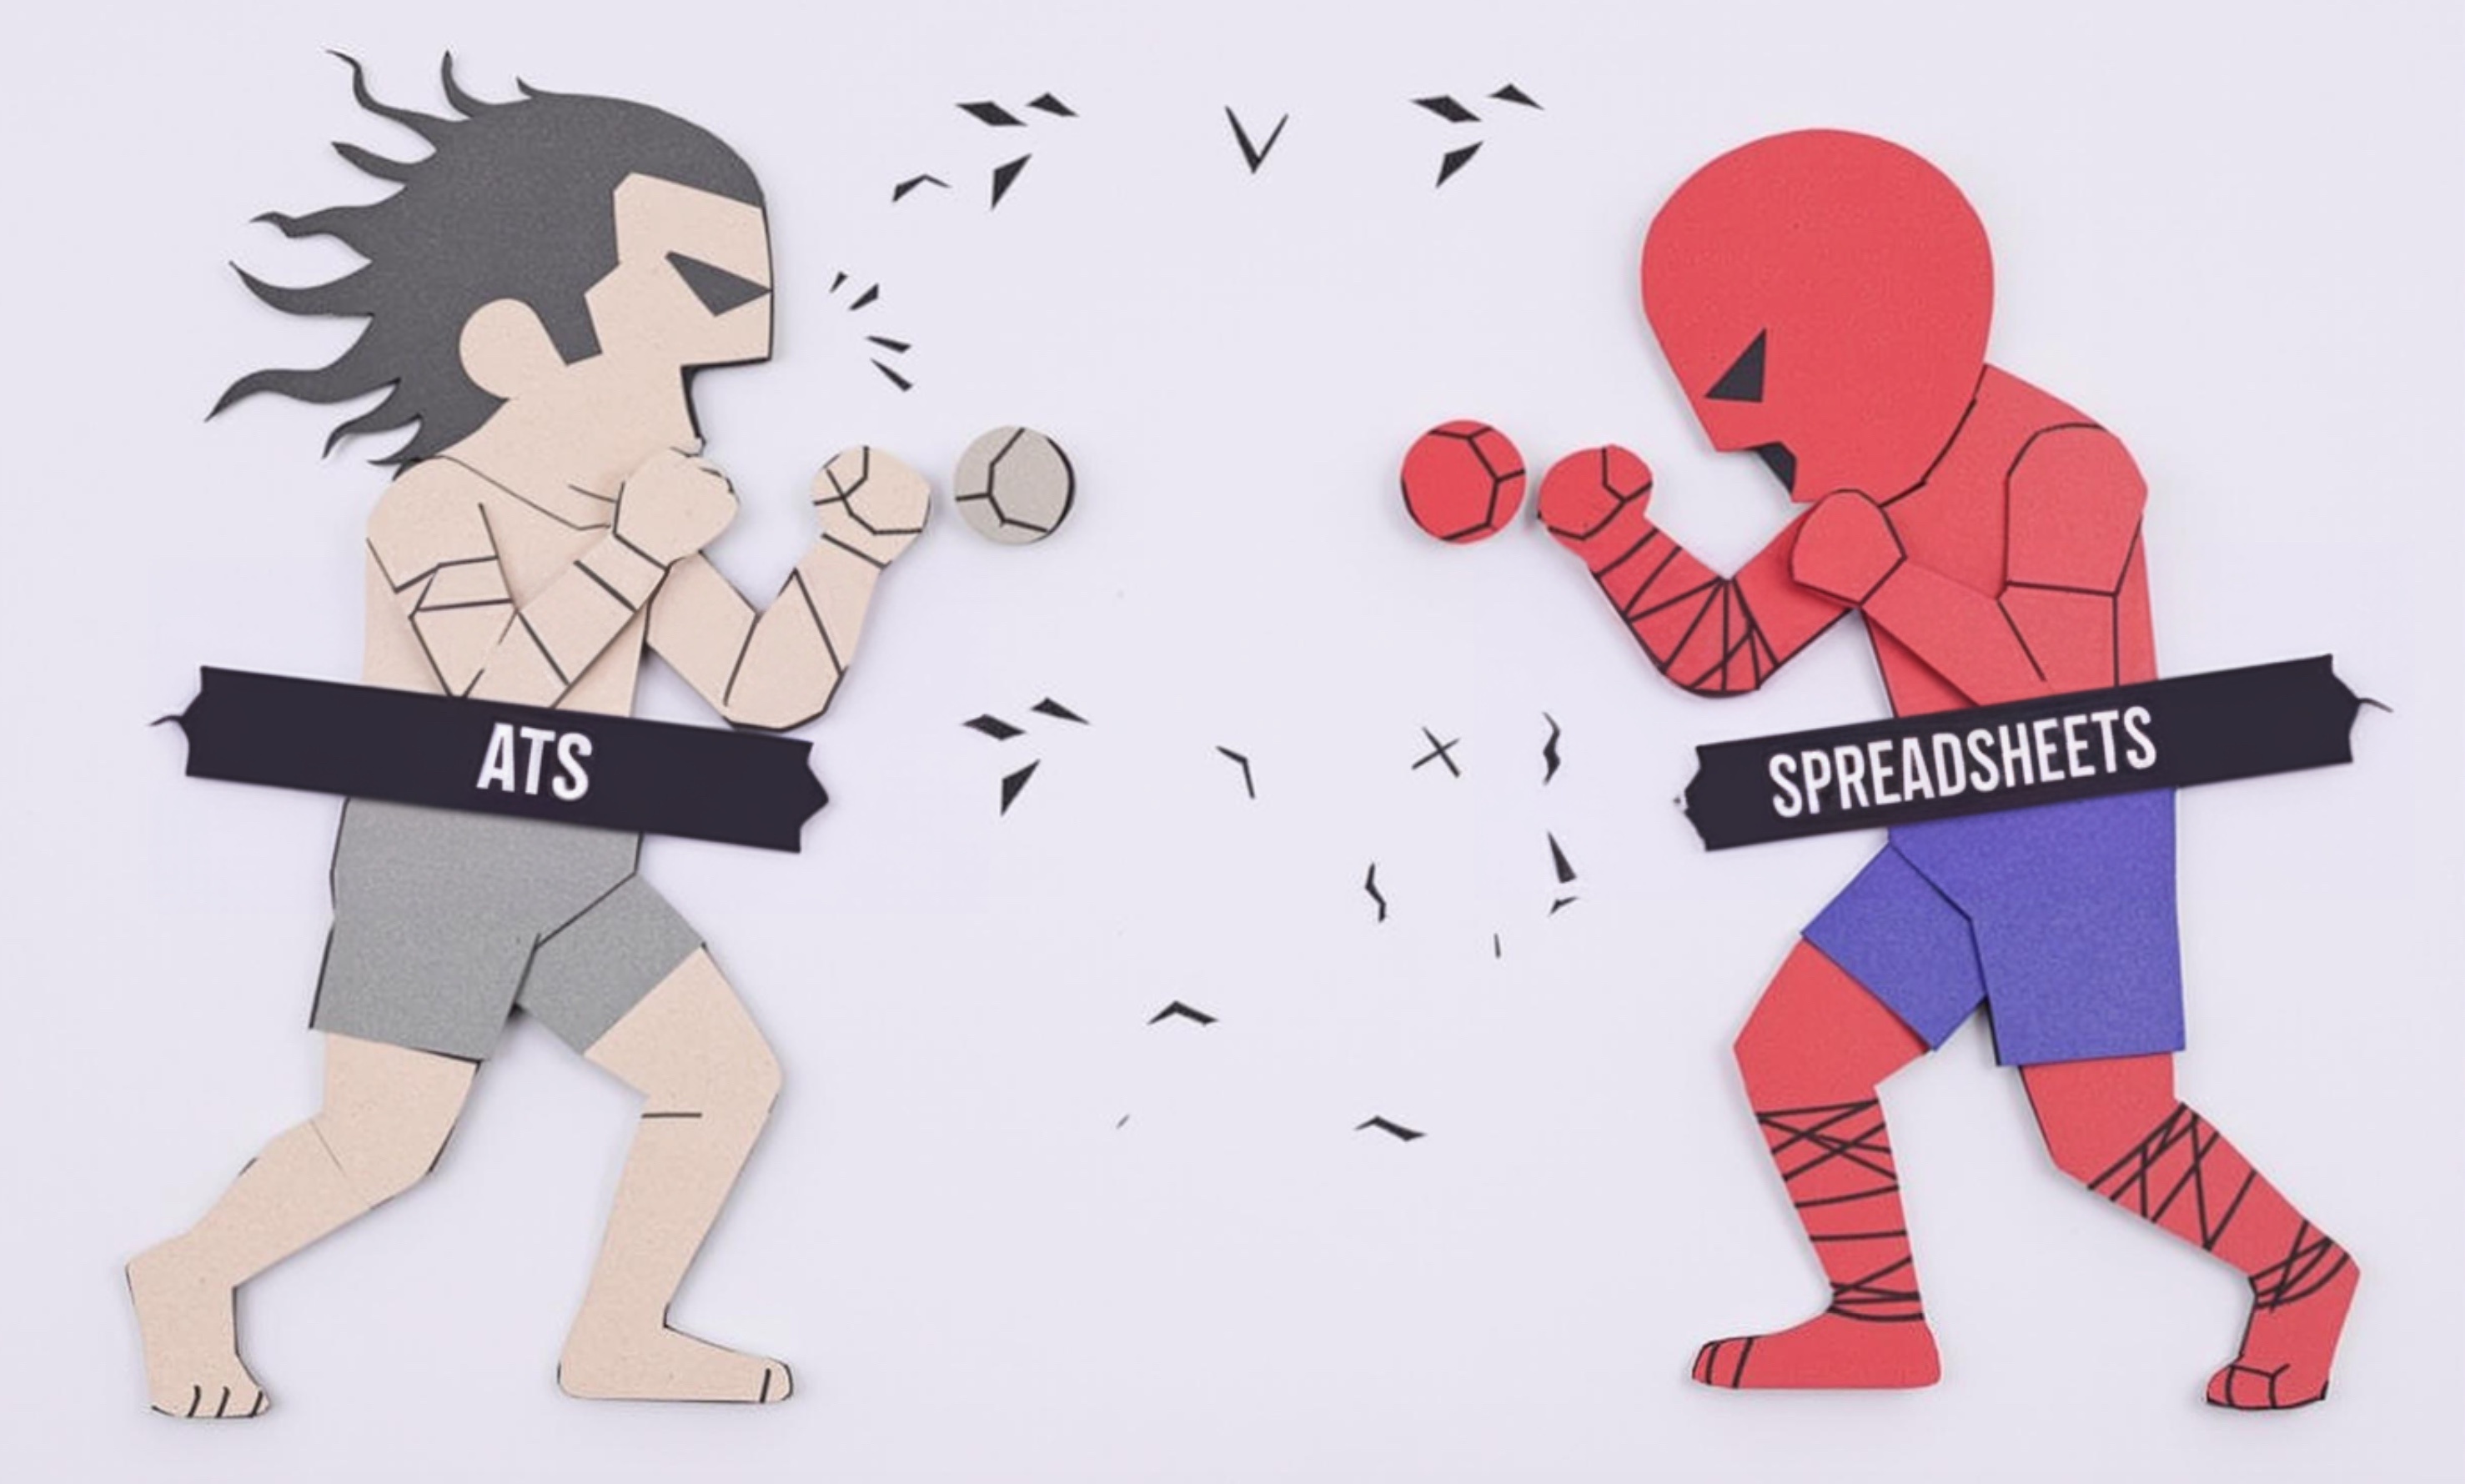
Why Your Hiring Spreadsheets Are Secretly Sabotaging Your Recruitment

Automated Scorecards in ATS Systems: Your Secret Weapon for Smarter Hiring Decisions

Unlocking Team Potential: Personality Mapping for Dynamic Management

