Infographic
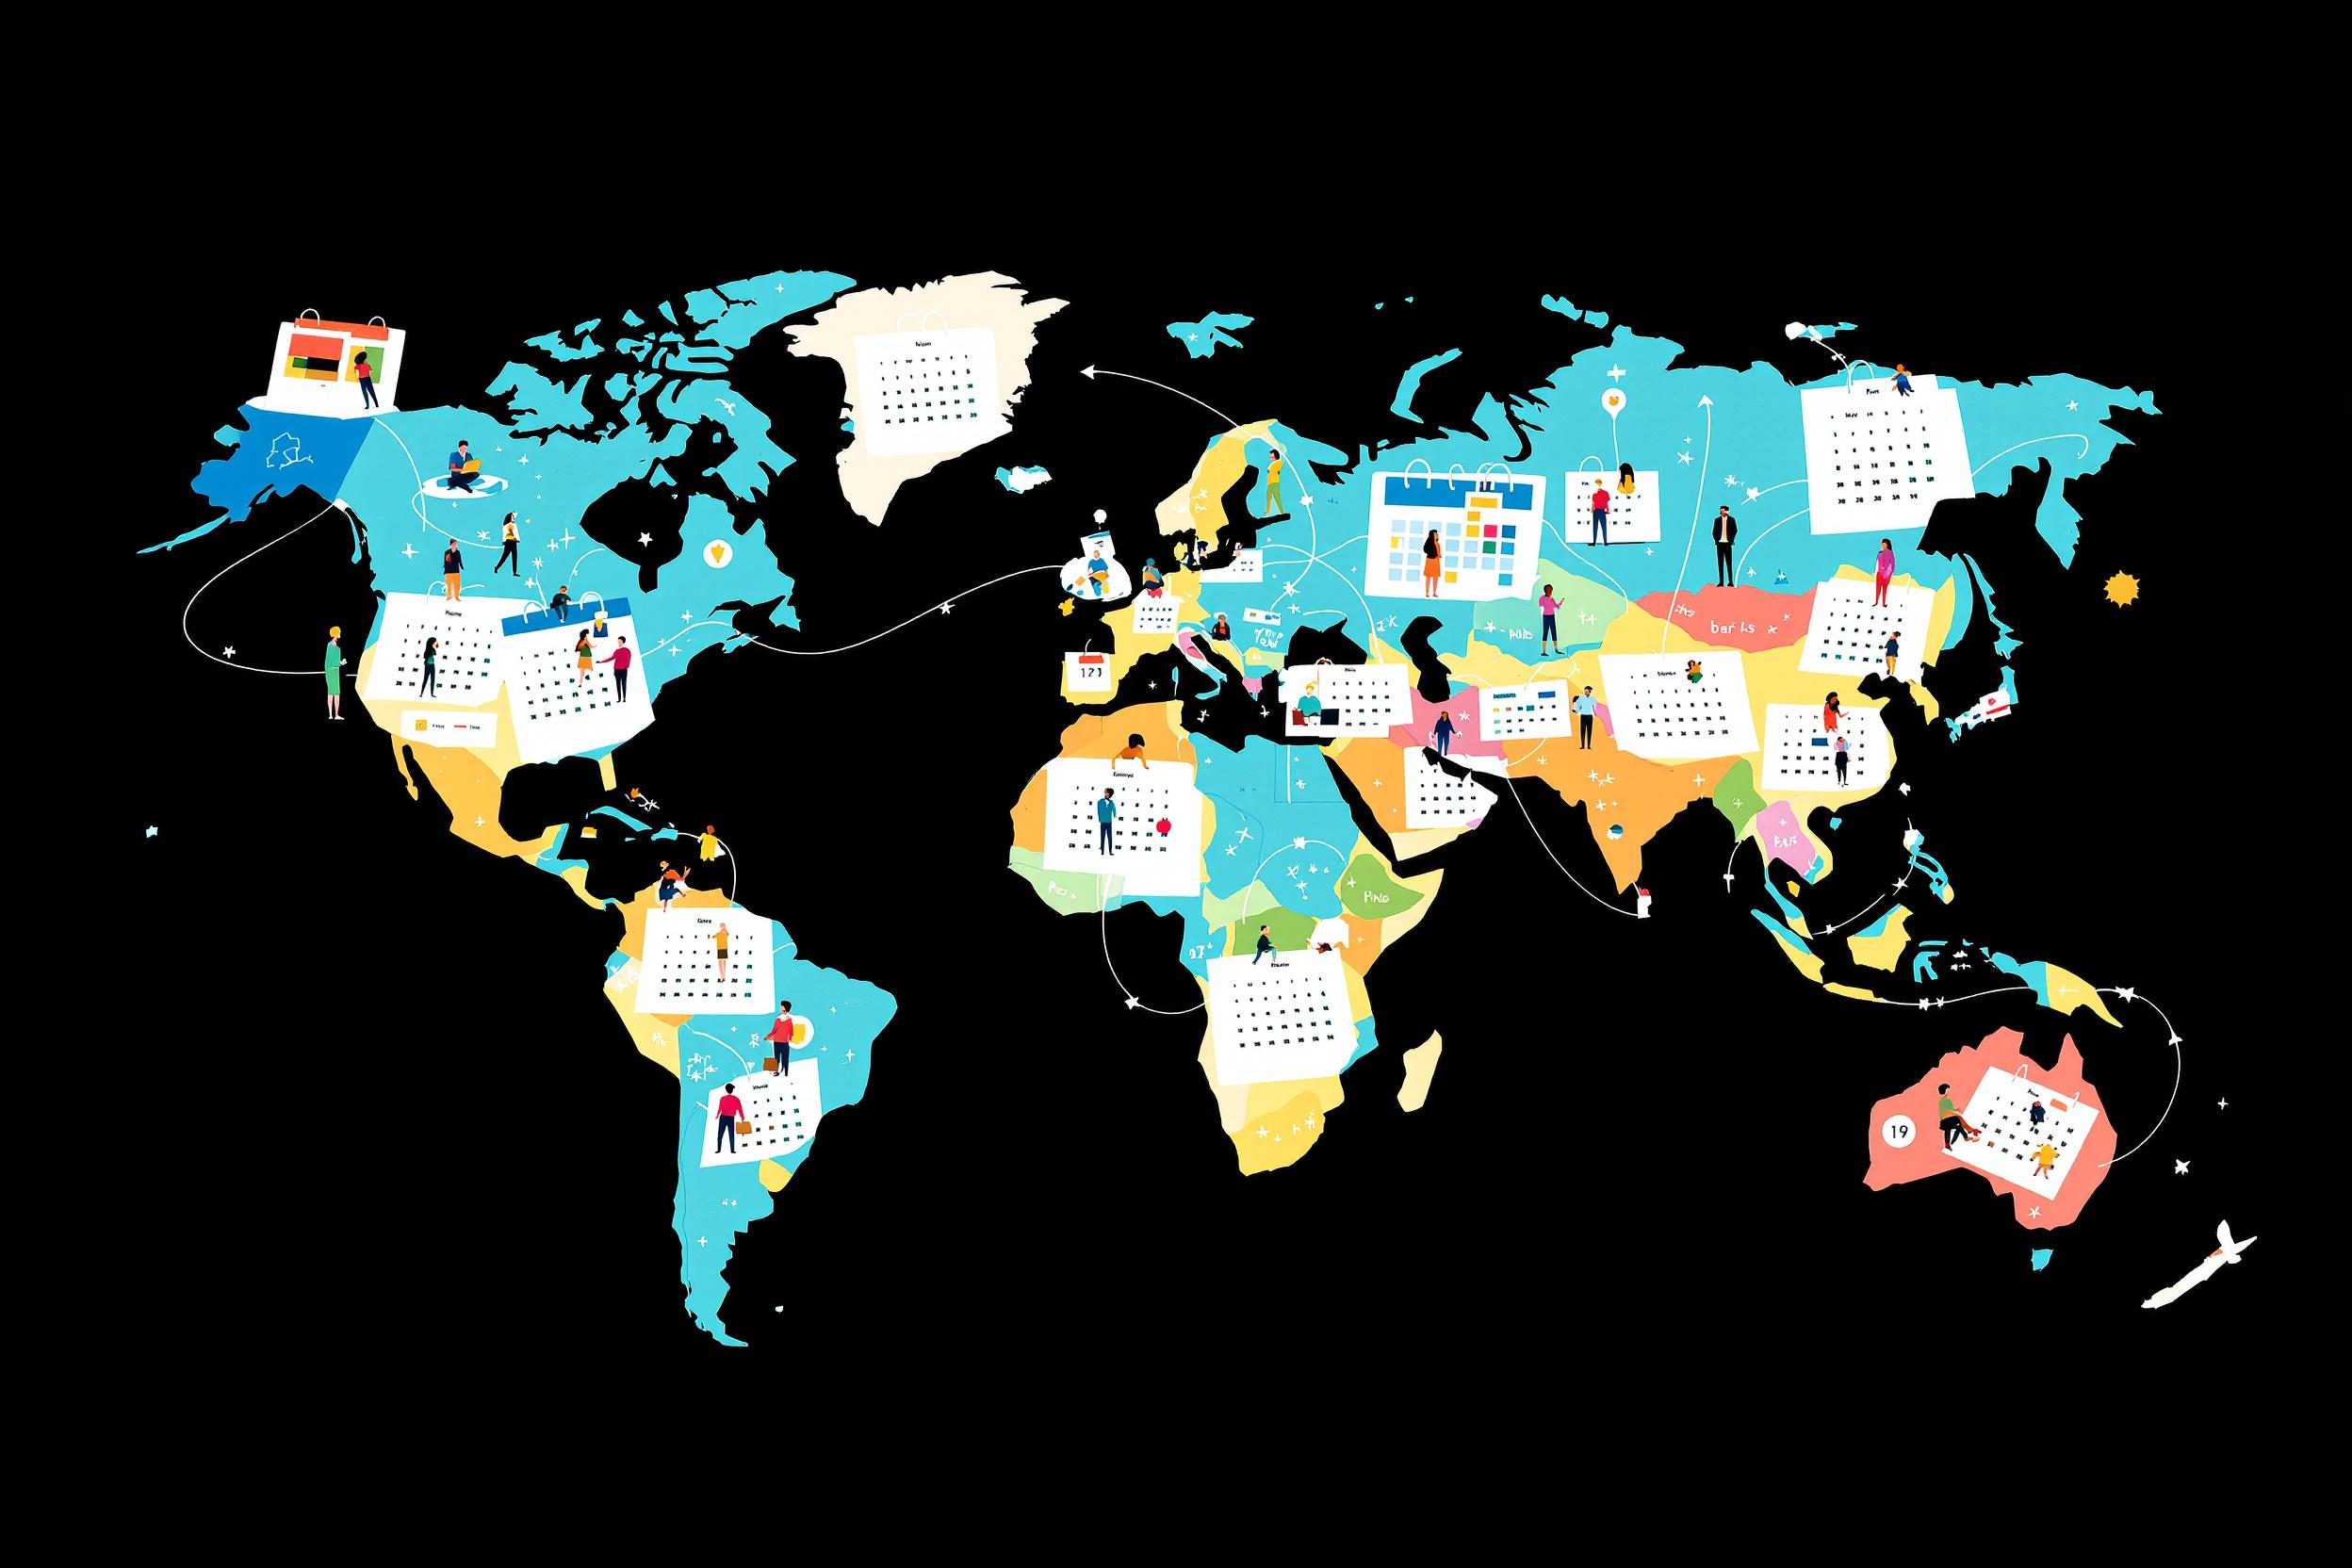
An infographic is a visual way to present information, data, or knowledge that combines images, charts, and minimal text to explain complex topics quickly and clearly. In publishing, it's like creating a picture story that helps readers understand information at a glance. These visual elements are increasingly important in both print and digital media because they catch readers' attention and make complicated information easier to understand. Similar terms you might see include data visualization, information design, or visual storytelling.
Examples in Resumes
Created engaging infographic designs that increased reader engagement by 45%
Led team in developing weekly infographics for the business section
Collaborated with reporters to transform complex data into clear infographic presentations
Typical job title: "Infographic Designers"
Also try searching for:
Where to Find Infographic Designers
Professional Organizations
Job Boards
Online Communities
Example Interview Questions
Senior Level Questions
Q: How do you manage complex data visualization projects from start to finish?
Expected Answer: Look for answers that show experience in leading teams, working with various departments, meeting deadlines, and maintaining quality across multiple projects. They should explain how they handle the whole process from data collection to final publication.
Q: Tell me about a time when you had to explain a particularly complex topic through an infographic.
Expected Answer: The candidate should describe their process of breaking down complex information, choosing appropriate visual elements, and ensuring accuracy while maintaining visual appeal. They should also mention how they measure success of their infographics.
Mid Level Questions
Q: What tools and software do you use to create infographics?
Expected Answer: They should be familiar with industry-standard design software and demonstrate knowledge of both print and digital design requirements. Look for mentions of Adobe Creative Suite, data visualization tools, and possibly coding skills.
Q: How do you ensure accuracy in data representation while maintaining visual appeal?
Expected Answer: Should discuss fact-checking processes, working with subject matter experts, and balancing aesthetic choices with accurate data representation.
Junior Level Questions
Q: What makes an effective infographic?
Expected Answer: Should mention clear visual hierarchy, appropriate use of colors and fonts, balance between text and images, and the importance of telling a clear story through visuals.
Q: How do you approach designing an infographic for different platforms (print vs. digital)?
Expected Answer: Should understand basic differences between print and digital requirements, including resolution, color modes, and interactive possibilities for digital formats.
Experience Level Indicators
Junior (0-2 years)
- Basic design software knowledge
- Understanding of color theory and typography
- Simple chart and graph creation
- Basic data visualization principles
Mid (2-5 years)
- Advanced design software proficiency
- Complex data visualization creation
- Editorial design experience
- Cross-platform design adaptation
Senior (5+ years)
- Project management
- Team leadership
- Advanced storytelling through visuals
- Strategic planning of visual content
Red Flags to Watch For
- No portfolio of published work
- Lack of attention to detail in designs
- Poor understanding of data accuracy importance
- Unable to explain design choices
- No experience with deadline-driven environments
Need more hiring wisdom? Check these out...

Beyond Spreadsheets: Why Executive Dashboards in ATS Systems Are Your Secret Hiring Weapon

Beyond Borders: Mastering the Art of a Global Onboarding Calendar

Workforce Solutions Aggregators: The Next Big Thing You Didn't Know You Needed

